Local Roads
Local Road and Bridge Conditions
Indiana’s original ‘Community Crossings’ legislation became law in 2016. The program was intended to spur economic growth and improve the condition of local roads and bridges throughout the state. HEA 1002-2017 provided additional sustained funding for the program. The Purdue University Local Technical Assistance Program (LTAP) has collected condition assessment data from local communities for the past several years. LTAP reports that pavement conditions have improved in Indiana Counties, Cities and Towns since 2015.
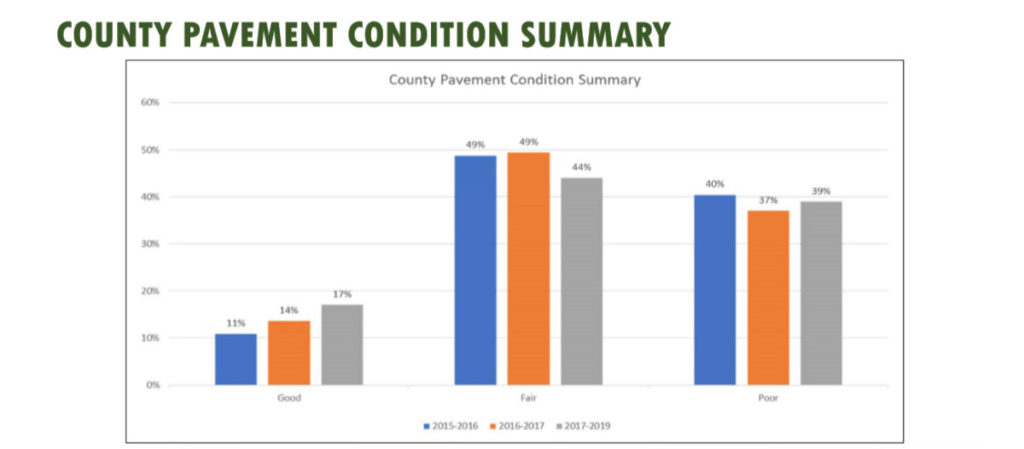
County Pavement Condition Report
Since 2016, LTAP has received pavement and inventory data and condition ratings from all 91 counties. (Marion County is included with Indianapolis.) The County Condition Summary below represents 38,870 centerline miles of the total inventory of 63,347 centerline miles in the counties.
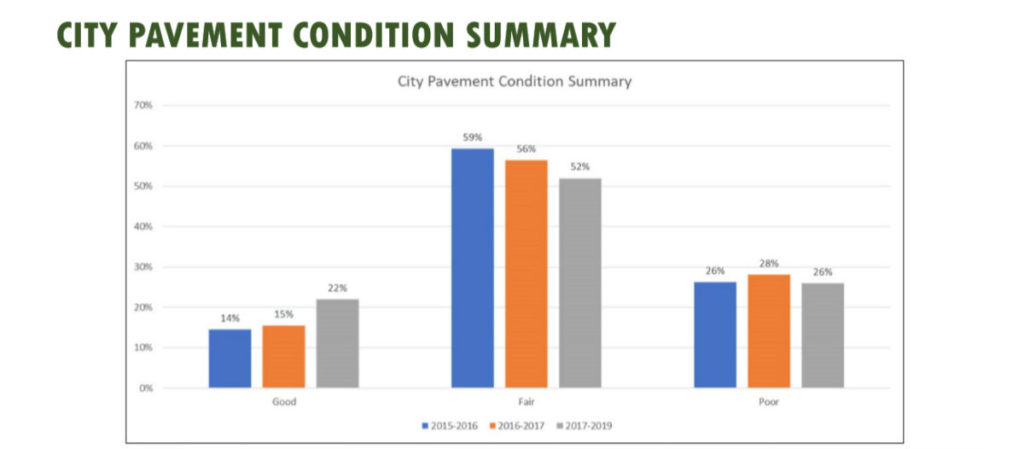
City Pavement Condition Report
Since 2016, LTAP has received pavement and inventory data and condition ratings from all 120 Indiana cities. This Condition Summary consists of 10,836 centerline miles of the total inventory of 16,328 centerline miles in Indiana’s cities.
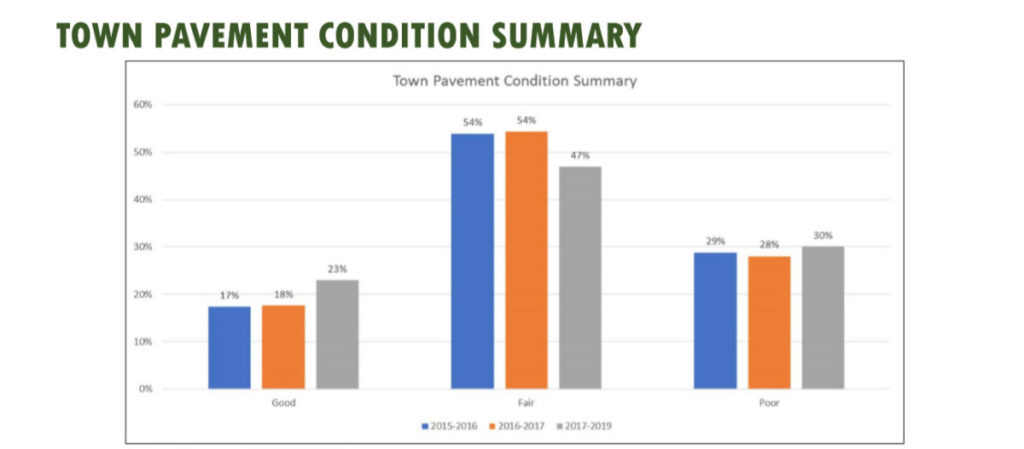
Town Condition Report
Since 2016, LTAP has received pavement and inventory data and condition ratings from 347 of 443 Indiana towns. This Condition Summary represents 4,429 centerline miles of the total inventory of 5,128 centerline miles in Indiana towns.
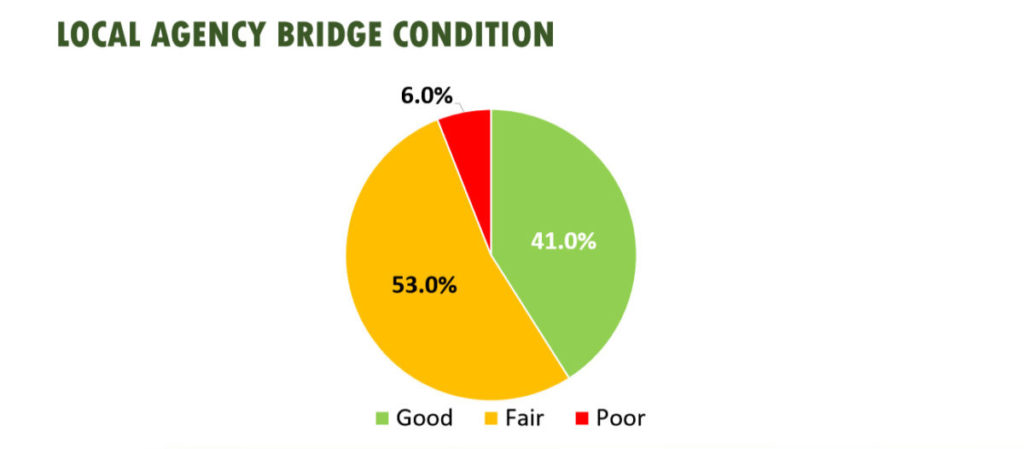
County Bridge Condition Report
There are approximately 13,185 bridges maintained by Indiana’s counties that are on the National Bridge Inventory (NBI). This represents nearly 32 million square feet of bridge deck area. For a bridge to be included on the NBI, it must be longer than 20 feet. Bridges are inspected on a 24-month maximum interval and the condition ratings are recorded in the state database. The chart below summarizes overall bridge ratings based on the current data and Federal Highway Association (FHWA) bridge condition guidelines.
A more detailed analysis quantifies the County Bridge inventory by level of deficiency:
Structurally Deficient: 1,008 or (8%)
Functionally Obsolete: 2,143 or (16%)
Closed: 83 or (0.6%)
Posted for Reduced Live Road: 1,458 or (11%)
Learn more about the roads and bridges serving Hoosier communities at LTAP’s 2019 Local Road & Bridge Condition Report.